Every programmer, from beginners to experienced developers, encounters bugs. If you’ve ever spent an hour searching for a missing semicolon or wondering why your program won’t run, you’re not alone. The good news is that debugging is a skill you can learn and improve with practice.
In this guide, How to Debug Your Code Like a Pro, you’ll discover practical debugging techniques that help you identify problems faster, understand error messages, and write more reliable code. Instead of feeling frustrated by bugs, you’ll learn how to approach them like an experienced developer.
What Is Debugging?
Debugging is the process of finding, understanding, and fixing errors in your code. These errors, often called bugs, can prevent your program from working as expected.
A bug might cause:
- A program to crash
- Incorrect output
- Missing functionality
- Slow performance
- Unexpected behavior
Debugging isn’t just about fixing problems—it’s about understanding why they happened in the first place.
Why Debugging Is an Essential Skill
Many beginners think professional developers write perfect code. The truth is, experienced programmers spend a significant amount of time debugging.
Strong debugging skills help you:
- Solve problems more efficiently
- Learn how programming languages work
- Improve code quality
- Build confidence
- Save time during development
The faster you learn to debug, the faster you’ll grow as a developer.
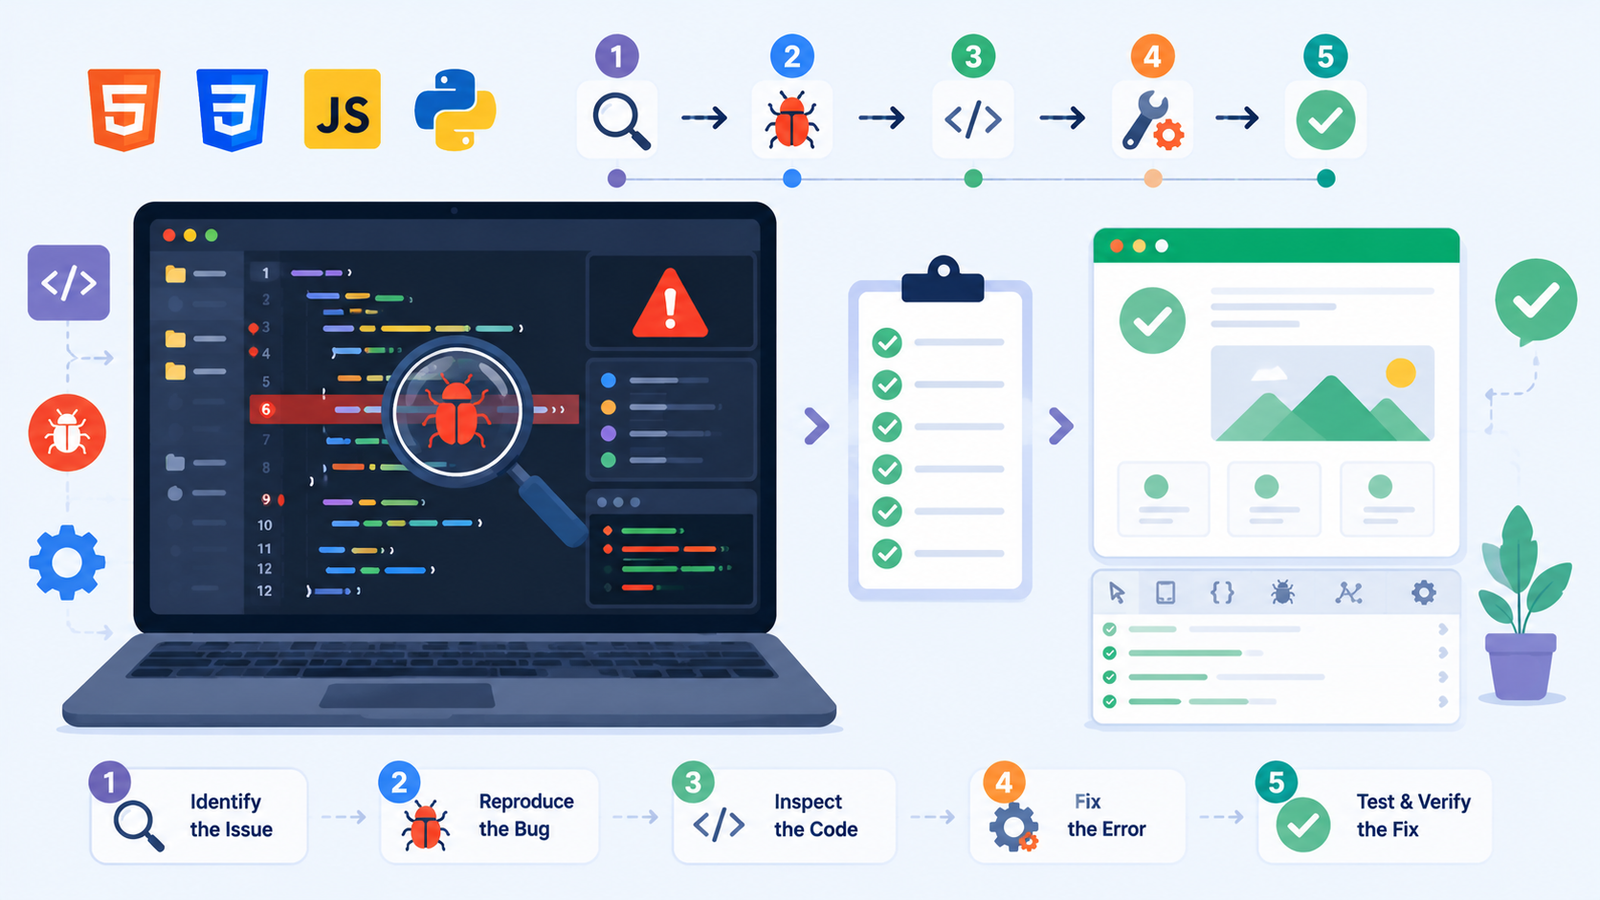
Step 1: Read the Error Message Carefully
One of the biggest beginner mistakes is ignoring the error message.
Instead, read it carefully.
An error message usually tells you:
- The type of error
- The file where it occurred
- The line number
- Sometimes even a suggested solution
For example:
“`javascript id=”h7m2kp”
ReferenceError: userName is not defined
This tells you that JavaScript cannot find a variable named `userName`.

Instead of guessing, start your investigation there.

## Step 2: Check Your Syntax

Many bugs come from small typing mistakes.

Look for things like:

* Missing brackets
* Missing quotation marks
* Missing semicolons
* Misspelled keywords
* Unclosed HTML tags

Example:

Incorrect:
javascript id=”v3r8na”
if (score > 50 {
console.log(“Passed”);
}
Correct:javascript id=”f6q1tw”
if (score > 50) {
console.log(“Passed”);
}
A single missing parenthesis can stop your entire program.

## Step 3: Use Console Output

One of the simplest debugging tools is `console.log()`.

Example:
javascript id=”g9x4cl”
let total = price + tax;
console.log(total);
Printing variable values helps you understand what your program is doing at each step.

You can also inspect objects and arrays.
javascript id=”m4k7yb”
console.log(user);
console.log(products);
This technique works in JavaScript, while other languages have similar print functions.

## Step 4: Isolate the Problem

Large programs can be overwhelming.

Instead of looking at everything, focus on one section at a time.

Ask yourself:

* Which function is failing?
* Which input causes the issue?
* When does the error appear?

Breaking a problem into smaller pieces makes it much easier to solve.

## Step 5: Use Browser Developer Tools

Modern browsers include powerful debugging tools.

Open Developer Tools by pressing:

* **F12**
* **Ctrl + Shift + I** (Windows)
* **Cmd + Option + I** (Mac)

Useful features include:

* Console
* Elements inspector
* Network tab
* Sources panel
* Breakpoints

These tools help you inspect your webpage and track JavaScript execution.

## Step 6: Test with Simple Inputs

Sometimes bugs only appear with certain values.

Instead of testing many scenarios at once, start with simple examples.

For example:
javascript id=”t2n6qr”
add(2, 3)
Then try:javascript id=”w8p5df”
add(0, 0)
add(-5, 2)
Testing different inputs often reveals hidden problems.

## Step 7: Use Comments to Narrow Down the Issue

Temporarily comment out sections of code.

Example:
javascript id=”z1j9vc”
// calculateDiscount();
// updateCart();
If the error disappears, you've narrowed down the source of the problem.

This technique is especially useful in larger projects.

## Step 8: Learn to Use a Debugger

Professional developers rarely rely only on `console.log()`.

Most code editors include built-in debuggers that allow you to:

* Pause execution
* Inspect variables
* Step through code line by line
* Watch expressions
* Examine function calls

Learning to use a debugger early will save you countless hours later.

## Common Types of Programming Errors

Understanding different error categories makes debugging easier.

### Syntax Errors

These occur when your code breaks language rules.

Example:

Missing brackets or quotation marks.

### Runtime Errors

These happen while your program is running.

Example:

Trying to access a variable that doesn't exist.

### Logical Errors

These are the trickiest because the program runs without crashing but produces incorrect results.

Example:
javascript id=”y5c8lu”
let total = price – tax;
The code runs successfully, but the calculation is wrong.

## Practical Debugging Habits

Experienced developers follow consistent habits when solving problems.

Here are a few worth adopting:

1. Change only one thing at a time.
2. Test frequently.
3. Save working versions of your code.
4. Read documentation when you're unsure.
5. Don't ignore warnings.

Small, careful changes make debugging much easier.

## A Simple Debugging Example

Imagine this code:
javascript id=”e3v6ks”
let age = 18;
if(age = 18){
console.log(“Adult”);
}
The program behaves unexpectedly.

After inspecting the condition, you notice:
javascript id=”p9r2hd”
if(age === 18){
“`
The original code used the assignment operator (=) instead of the comparison operator (===).
Finding tiny mistakes like this becomes much easier when you read your code slowly and test each step.
Common Beginner Mistakes
Avoid these habits when debugging.
Guessing Without Testing
Changing random lines of code usually creates more problems.
Always test one idea at a time.
Ignoring Documentation
Official documentation often explains errors more clearly than guessing.
Learning to read documentation is a valuable programming skill.
Giving Up Too Quickly
Some bugs take time to solve.
Every difficult bug teaches you something new.
Patience is one of the most important debugging tools.
Final Thoughts
Learning How to Debug Your Code Like a Pro isn’t about memorizing every possible error. It’s about developing a systematic way of thinking. Read error messages carefully, test your code step by step, use debugging tools effectively, and stay patient when problems arise.
Remember, every programmer encounters bugs—it’s a normal part of writing software. Each issue you solve improves your problem-solving skills and deepens your understanding of programming. The next time your code doesn’t work, resist the urge to panic. Open your editor, investigate the problem one step at a time, and enjoy the process of figuring it out. If you discover a debugging technique that works especially well for you, share it in the comments and help other beginners learn.